Enable text based alternatives for graph display and drawing entry

Click here to erase all data entry on this page

Using Beer's Law to find the Concentration of an Unknown Solution

Spectrophotometry is an analytical technique used to measure the amount of light of a particular wavelength absorbed by a sample in solution. This measurement can then be related to the concentration of the solution.

The general relationship between absorbance and concentration is known as the Beer-Lambert law.
A = εcl, where A is the absorbance, c is the concentration (in M), and l is the pathlength of the cuvette, through which the light passes. (Our cuvettes have l = 1.00 cm).

You will create a set of standards, or solutions of known concentration. You will measure the absorbance of each of these solutions and create a calibration curve with the data you collect. From that curve, you will find the molar absorptivity, ε, of this compound. Then you will measure the absorbance of a solution with unknown concentration and using the calculated ε and known l, you will find the c.

It is important to recognize that the color of a solution is related to the wavelength of light absorbed by the solution, in a complementary way.
For example, a solution which appears purple does so because the purple wavelength region of the spectrum of the white light is not being absorbed by the solution, whereas significant absorption is taking place for the non-purple wavelength regions of the visible spectrum. Solutions which appear to have a particular color, e.g., purple, absorb wavelengths of light associated with colors primarily on the opposite side of the color wheel, e.g., orange and yellow.

For this activity, you will be measuring the absorbance of solutions of Cr(NO3)3.

To start this activity, click this link for Beer's Law Concentration. The lab will load in a new tab. Click back to this tab to read further instructions and complete the questions below.

1. The lab is setup with a white light shining through a cuvette in the middle of the bench, with a video camera on the right hand side. In the Live Data display, on the right hand side of the screen, you can see an image of the cuvette with the prepared solution in it.

What color is the solution?


You will now switch out the video camera for a spectrometer and measure the absorbance in the orange-yellow range- around 574nm.

  1. Open the Stockroom tab on the right hand side of the screen and expand the Detectors menu.
  2. Click the trashcan next to the Video Camera to remove the video camera from the table.

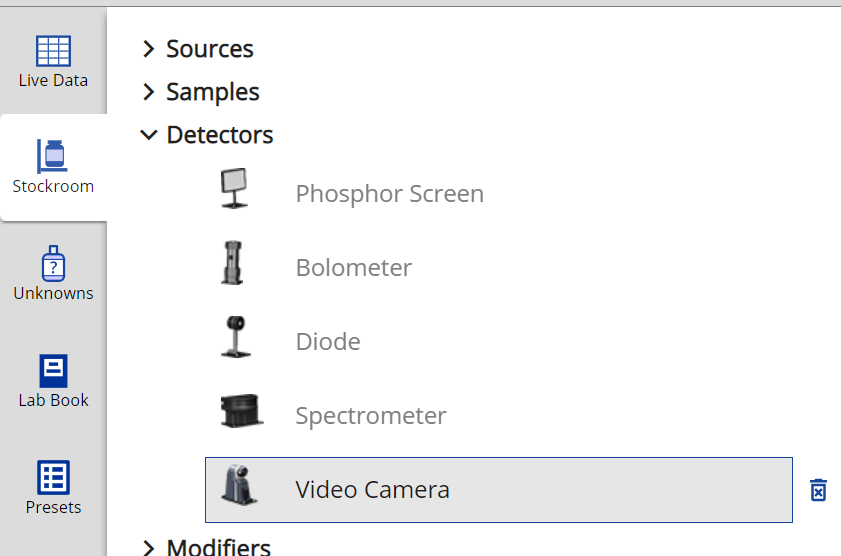
  1. Select the Spectrometer and then drag it from the stockroom counter to the lab bench, where the video camera had been.
  2. Open the Live Data tab and click the slide switch to turn on the Spectrometer. You will see the Intensity spectrum for the solution in the cuvette. Toggle to just the Visible spectrum on the bottom, and from Intensity to Absorbance on the left hand side of the graph.
  3. Drag your mouse over the peak around 574 nm and you will see data values for the absorbance curve.
  4. Record the absorbance at the point closest to 574 nm in the table below.
  5. Now you will measure the absorbance of the rest of the standard solutions. To do that, open the Stockroom tab, expand the Samples menu, then Liquids, then Beer's Law. You will see the concentration of the first solution you tested there. Click the trashcan beside the Cr(NO3)3 label to empty that solution. Type in the next concentration from the table below. Click Enter to set that concentration. Then click the Cr(NO3)3 label to fill the cuvette with the new standard solution.
  6. Open the Live Data tab and measure the absorbance of the new solution from the spectrum and record it in the table.
  7. Repeat for all of the indicated concentrations.
Concentration Cr(NO3)3 (M) Absorbance
0.105
0.085
0.065
0.045
0.025

Data Analysis

  1. Open a spreadsheet program, like Excel or Desmos, and plot your data points, with Absorbance on the y-axis and Concentration on the x-axis.
  2. Fit a linear trendline and make sure the equation is labeled on your graph, including the R2 value. 
  3. Fill in your equation below.

Absorbance = ·Concentration +

The slope of your equation gives you the ε·l in the Beer's law equation: A = εcl. Since l=1 cm, the slope is equal to the ε. The units of ε are 1/(M*cm).